[PHP IDE]
PHPEclipse: A plug-in of Eclipse.
PDT: a new PHP IDE which is also a plug-in of Eclipse. It is supported by Zend.
Aptana with PHP plug-in: Aptana is excellent tool to develop web2.0 applications. It excels at CSS + JS... I don't know whether its support for PHP is good as well.
[PHP Debug]
XDebug: This is a PHP extension which provides a lot of valuable debug information. Its installation is fairly simple. Users just need to download the extension, put it into PHP ext directory and modify php.ini file.
DBG PHP Debugger:
Zend Debugger: I googled and found this debugger. But I could not find related documents. So actually I don't know how to use it.
[PHP Test]
SimpleTest: A unit testing tool for PHP.
Finally, I selected PDT+Eclipse as my IDE. I found this article which describes how to debug in PDT. PHP programs can be debugged locally or on a remote server. PDT supports Zend Debugger and XDebug. PDT all-in-one package is suitable for those who want a new Eclipse+PDT+Prerequisites. If you have already installed Eclipse, you can just install PDT as plug-in. The latter is what I chose. After installing PDT, you need some configurations.
Instructions about how to configure and use all-in-one PDT package are listed here.
[Configuration of PDT]
Procedure to build PHP PDT environment not using all-in-one package:
(1) Install PHP and Debugger
To use PDT, first install PHP(I am using PHP 5.2.6). Then install corresponding PHP debugger module you choose(xdebug or zend debugger). My PHP version is 5.2.6 and I downloaded XDebug module from here. Then you need to configure PHP (modify php.ini) to use the debugger. Installation instructions about XDebug is here. After configuration, restart your web server to see whether XDebug is configured correctly. Function phpinfo() can be used. Or you can use command "php.exe -m" to list the loaded modules and XDebug should be in the Zend Module list.
(2) Configure PDT in Eclipse
If you don't use PDT all-in-one package, you need lots of configuration work.
There are two modes in which PHP can be run: script mode and web mode.
In web mode, you need a web server(e.g. Apache httpd) to host PHP applications and you can test your apps by accessing those PHP pages through browser. Generally, this is the way we publish our PHP programs when we finish.
In script mode, your PHP programs can be run by an independent executable file. PHP package provides an executable file called php.exe which can be used to execute your PHP program.

The most important configuration options are "Debug", "PHP Executables", "PHP Servers".
[Run/Debug]
You can debug and run your PHP program in both modes in Eclipse. When you open Run/Debug dialog in Eclipse, following dialog should be displayed:
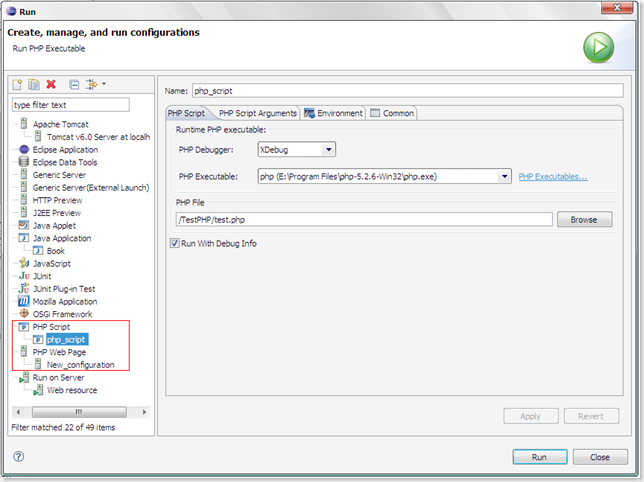
Note the two entries within red box. If you want to debug/run program as script, you should configure "PHP Executable" correctly. If you want to debug/run program on a web server, you should configure "PHP Server" correctly. Meanwhile, you should select the debugger you would like to use. This must match the debugger module you actually installed. If you install a Zend debugger for PHP while you set XDebug as your debugger in Eclipse, something unpredictable may occur.
You also can set the debug scope by clicking tab "Advanced":

Usage of these options is(The explanation is from help document of PDT):
- Debug All Pages - The specified page and all the pages linked to it are debugged. The browser waits for the debug of each page before displaying it.
- Debug First Page Only - Only the first page is debugged.
- Start Debug from - Select the URL from which you would like the Debugging process to start.
- Continue Debug from this Page - Selecting this option will result in all the pages linked to the URL being debugged.
When you debug PHP program in web mode(In script mode, you don't have this concern.), you must explicitly terminate the debugging process. When you click button "resume" to make the program execute until completion, the program actually does not terminate. One bug? or annoying thing is that the "Terminate" button in debug toolbar is disabled which gives users illusion that the debugged program is terminated. This illusion is natural because users don't have way to terminate the debugged program. However, the debugged app is still alive and waiting for new incoming requests. One way to terminate the debugged app is that: once more you access the debugged web page, and when the debugger stops at a breakpoint, click button "Terminate"(not button "Resume") to truly kill the debug process. Another way is that when you click an arbitrary statement in window "Debug", button "Terminate" is activated and enabled.
[Deploy]
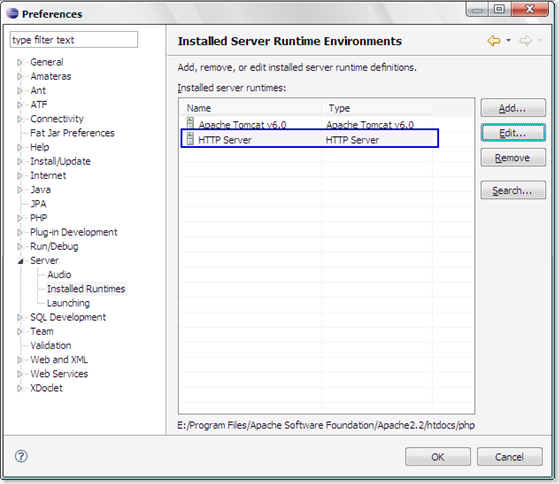
To test programs in web mode, a web server is necessary. In my case, web server is located in my local machine as well. One way to deploy the program during development is configure Apache httpd to change its document root to point to your development root directory. However, this is not good because other applications which don't reside in your current development root will not work. My solution is to use HTTP Server configuration in Eclipse. First, I add a new HTTP server to Eclipse.
Then I add the PHP application to that HTTP server:
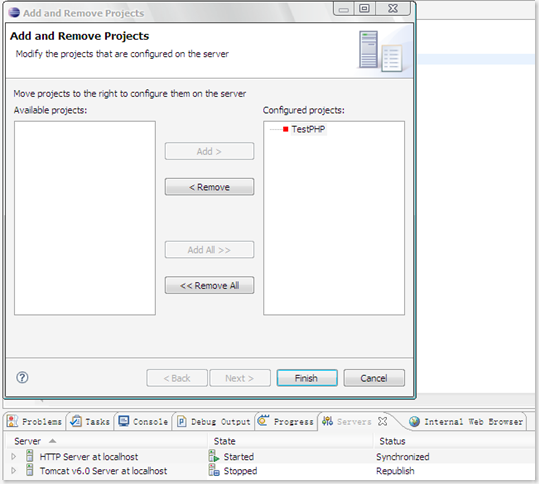
When I change a source file, Eclipse will automatically publish newest version of the file to the directory specified in HTTP Server configuration. I let it point to my original Apache Httpd document root.
[Issues]
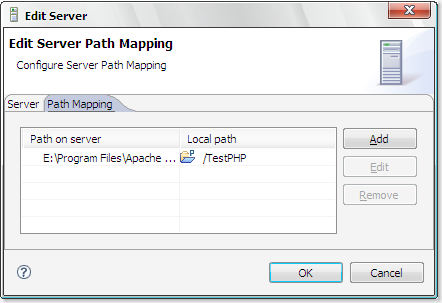
One issue I have not figured out is how to use the "Path Mapping" when PHP Server is set:
I don't know what that means. Hopefully, I will figure it out tomorrow.
Now, I know how to use Path Mapping.
When you run/debug your PHP page on web server, PDT needs a mapping relationship between remote document directory and current working directory. As you all know, client can not retrieve PHP source file by accessing it in browser. What is returned is output produced by PHP interpreter and web server. In other words, PDT has no way to get the PHP file you want to run/debug from remote web server. Instead, you must maintain a copy in local directory.
In my case, remote PHP URL is at http://localhost/php (I run web server on my local machine). And my Eclipse PHP working directory is different. Then I create a path mapping: "E:\Program Files\Apache Software Foundation\Apache2.2\htdocs\php\TestPHP" => "/TestPHP"(Path in Eclipse workspace, you also can use absolute path in file system). When I access http://localhost/php/TestPHP/test.php, the file /TestPHP/test.php is displayed and traced in Eclipse debug window. The php file on remote server is debugged and local PDT communicates with remote server/debugger by specific debugging protocol. Apache http server will check the existence of requested php file before it transfers processing control to PHP interpreter. If no corresponding php file is found by web server, error message is returned. If content of file on remote server and content of local file is different, weird behaviors may occur. Generally, they should be identical. To sum up, debugging occurs on remote server and PDT uses local php source file to display debug information and let user control (step in, step over...) the progress of debugging.


